InUX CollectivebyKai WongReplace your complex bar chart with a dot plot to make it better understoodThe alternative to bar charts that works well with complex dataSep 2, 20213Sep 2, 20213
InTDS ArchivebyParul Pandey10 Free tools to get started with Data Visualisation-Easily & Instantly.Jump right into the Data Visualisation process with these easy and intuitive tools.Mar 12, 201921Mar 12, 201921
Lilian KlemzChurn: tudo o que você precisa saber sobre esta métrica para alavancar seu negócio.Não à toa, disse uma vez Philip Kotler: é de 5 a 7 vezes mais caro atrair um novo cliente do que é manter um já existente.Mar 12, 20172Mar 12, 20172
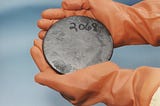
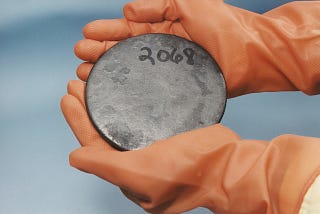
Flávio ClésioDados: O novo petróleo ou o novo urânio?Eu venho pensado ultimamente sobre o papel de engenheiros de dados e de machine learning em relação a forma na qual nós trabalhamos…Apr 4, 20215Apr 4, 20215